Call to Action
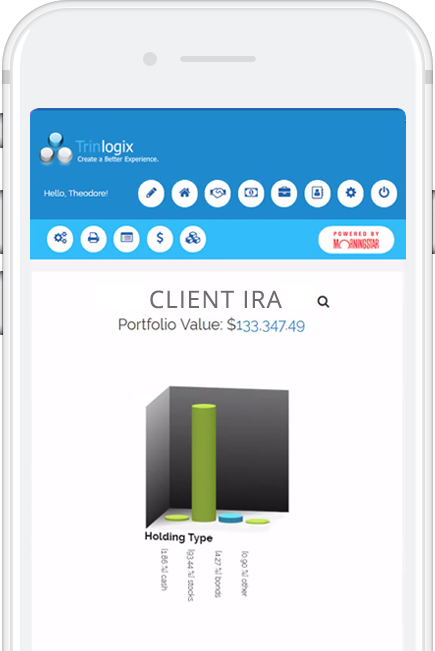
Simplified reports allow clients to easily see their portfolios in action. Our patented platform helps you spend your time more effectively and provide clients with greater clarity of their investment portfolio via easy to understand graphics and snapshots.
Financial Reporting Software
Trinlogix financial planning tools for advisors allow you to present reports and materials in a clear, concise manner that gets straight to the point and beats Glossy Eye Syndrome – that dreaded look when information is boring or not easily understood. These simplified reports are easy to generate for clients and frees up your time, which is vital to financial advisors setting client goals. Trinlogix can help financial advisors achieve those goals in the reviewing and monitoring stages and all it takes is a single page to tell the story.


Customized Reporting
Customizable report generation is a breeze with Trinlogix investment tools for visualizing financial information. You can quickly and easily prepare interactive 3D images to present your clients with big data that is easy to understand. Our 3D images are highly visual and move, creating ideal data report visualization for your clients. A recent MIT study showed 72 percent of people prefer motion views versus static views. Highly visual reports provide greater clarity for your clients and increase their engagement. Clients and advisors both win when using innovative investor reporting software like Trinlogix’s to view client portfolios.

Ready to give Trinlogix a try?
Request a Demo Today!
See our award-winning investment performance tools in action.

CUSTOMERS
©2018 Trinlogix All rights reserved.
Various trademarks held by their respective owners.
Terms and Conditions | Privacy Policy

